#kubernetes (2021-03)

Archive: https://archive.sweetops.com/kubernetes/
2021-03-01
Hi everyone, I have two online events coming up that will be recording on CKAD/CKA study and exam tips, here are the links for those interested:

I’m attending CNCF Manly w/ Cloud Native Dojo - CKA Study & Exam Tips on Mar 30, 2021

I’m attending CNCF Manly w/ Cloud Native Dojo - CKAD Study & Exam Tips on Mar 9, 2021
2021-03-03
Not exactly a Kubernetes question, but figured folks in this channel would know what I’m talking about exists — Does anyone know if there is a Network / TCP proxy tool out there that will do a manage-and-forward pattern (my own made up term for describing this) for long lived TCP connections?
I have a client running on K8s and one of their primary microservices holds long lived TCP socket connections with many thousands of clients through an AWS NLB. The problem is that whenever we do a deployment and update those pods the TCP connections require a re-connection which results in problems on the client side. So to provide an better experience for the clients we’re looking at what we can do to have those TCP connections always stay alive. My first thought is for a proxy layer that manages the socket connections with the client and then forwards socket connections to the actual service pods. That way even if the pods are swapped out behind the scenes, the original socket connection is still up and has no adverse affects on the clients.
Does the backend service maintain any state? In the event the responsible backend terminates could you send any requests to any other backend?
Be worth looking at the aws NLB issues in kubernetes GitHub. Tldr is that you want eks 1.19 and the new aws load balancer controller because otherwise:
- Proxy drain results in 500, no graceful draining of lb targets
- Scale up of nodes results in 500s as nodes are healthy on startup before being married unhealthy until complete process and then health check heathy. So there are dragons.
Service is stateless. Could send any incoming socket messages to any other backend.
I think ultimately you need solid client reconnection behavior on kubernetes due to all the stuff in the network path and what can affect routing.
Alternatively you could run the proxy on EC2 and forward into kubernetes but you would need to solve for service discovery (pod ip) to route direct and minimize hiccups.
What issue are you referring to? Client is setup with the aws-lb-controller for the NLB creation / management, but we’re on 1.18… is 1.19 out yet?
FWIW I looked at something similar for webrtc sessions and the agones project but ultimately went with EC2.
Sorry don’t have issues off hand, nlb termination etc should come up in search. Been some big ones. :)
Hi All,
we have 4 node kubernetes cluster in production deployed using kops in AWS, 3 worker node and one master nodes are c4.2xlarge 16gb memory each
with other pods we have elasticsearch deployed using helm, there we have 3 elasticsearch-data pods consumes 4000mb of memory each 3 elasticsearch-master pods consumes 2600mb of memory each 3 elasticsearch-client pod consumes 2600mb of memory each
all are distribed amoung nodes but one of the in one node, one of the elasticsearch-data pod is restarting daily like 2-3 times in a same node
i described the restarted pod which says just
Last State: Terminated
Reason: OOMKilled
Exit Code: 137
Started: Tue, 02 Mar 2021 20:31:07 +0530
Finished: Wed, 03 Mar 2021 17:46:02 +0530
there is no events
and when i checked the syslogs of the nodes in which the pod restarted it shows
C2 CompilerThre invoked oom-killer: gfp_mask=0x24000c0(GFP_KERNEL), nodemask=0, order=0, oom_score_adj=901
C2 CompilerThre cpuset=6126d0823d683f51d04603c4c6464c030464d3748c916c1a46621936846aac01 mems_allowed=0
CPU: 2 PID: 7743 Comm: C2 CompilerThre Not tainted 4.9.0-9-amd64 #1 Debian 4.9.168-1
Hardware name: Amazon EC2 c5.2xlarge/, BIOS 1.0 10/16/2017
...........
..
.
the version of elasticsearch is 6.7.0
anyone experienced same issue how to solve this pod restart issue
OOMKilled / 137 is Out of Memory. ElasticSearch is super memory hungry so it just needs more memory likely or you need to play with your Pod limits / requests.
Fun fact: Exit Code 137 (128 + 9) –> it’s getting a signal 9 (SIGKILL)
2021-03-05
Hi All, Under what condition pod will exceeds its memory limit,
in my Kubernets cluster i have deployed elasticsearch deployed using helm, elasticsearch version is 6.7.0, we have 3 elasticsearch-data pods and 2 elasticsearch-master pods and 1 client,
memory limit for elasticseach-data pod is 4gb, but one of the data pod is restarted everyday about 5-6 times(oom kill), when i checked in Grafana for pod’s memory and cpu usage, i can see that one of the elasticsearch-data pod is using twice the memory limit(8gb) ,
So i wanted to know Under what condition pod will exceeds its memory limit,
also in syslogs- when oom_kill happened
C2 CompilerThre invoked oom-killer: gfp_mask=0x24000c0(GFP_KERNEL), nodemask=0, order=0, oom_score_adj=901
[28621138.637578] C2 CompilerThre cpuset=441fa5603f64f86888937bc911269fca47dfcdb318648cc1ac0832cdfb07134d mems_allowed=0
[28621138.639850] CPU: 5 PID: 7749 Comm: C2 CompilerThre Not tainted 4.9.0-9-amd64 #1 Debian 4.9.168-1
[28621138.641757] Hardware name: Amazon EC2 c5.2xlarge/, BIOS 1.0 10/16/2017
[28621138.643152] 0000000000000000 ffffffff85335284 ffffa53882de7dd8 ffff8dda11dec040
......
..
.
[28621138.662399] [<ffffffff85615f82>] ? schedule+0x32/0x80
[28621138.663485] [<ffffffff8561bc48>] ? async_page_fault+0x28/0x30
[28621138.669097] memory: usage 4096000kB, limit 4096000kB, failcnt 383494862
Here at shows aroung 4gb
but at last
[ pid ] uid tgid total_vm rss nr_ptes nr_pmds swapents oom_score_adj name
[28621138.876368] [24691] 0 24691 256 1 4 2 0 -998 pause
[28621138.878201] [ 7436] 1000 7436 2141564 989996 2342 11 0 901 java
[28621138.879983] Memory cgroup out of memory: Kill process 7436 (java) score 1870 or sacrifice child
[28621138.881978] Killed process 7436 (java) total-vm:8566256kB, anon-rss:3941732kB, file-rss:18252kB, shmem-rss:0kB
but here its showing total-vm is 8gb
am confused why its showing 4 in one place and 8 in another place
It’s not a pod that exceed the limit but program that you run on the pod - elk. elk is memory hungry and need to be configured to not to use more memory than it’s given otherwise either os or kubelet will kill it. so every program will get a score so it’s known what to kill first to preserve memory for prioritized applications
The Helm 2nd Security Audit is now completed. Check out the blog post by core maintainer @mattfarina and the reports here: https://helm.sh/blog/helm-2nd-security-audit/
2021-03-07
I just released a kubectl plugin I developed at my day job, maybe someone will find it useful https://github.com/qonto/kubectl-duplicate
A kubectl plugin for duplicate a running pod and auto exec into - qonto/kubectl-duplicate
2021-03-08
2021-03-11
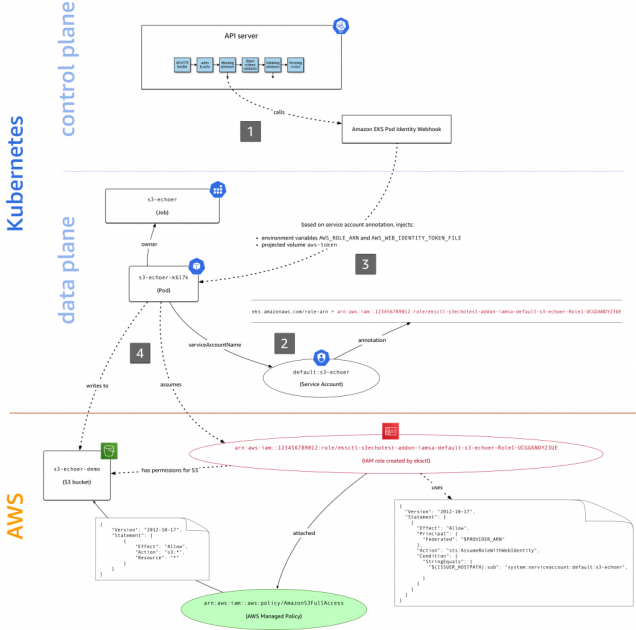
whats the recommendation for pod level iam roles? I know the ones being used the most initially was kube2iam and kiam but iirc one or both of them had rate limiting issues (which is why i avoided them initially). I know AWS came out with one here and was just curious what people are using nowadays or if theres a general consensus of best one https://aws.amazon.com/blogs/opensource/introducing-fine-grained-iam-roles-service-accounts/ Personally I’m using kops, so curious if theres issues integrating w/ aws irsa

Here at AWS we focus first and foremost on customer needs. In the context of access control in Amazon EKS, you asked in issue #23 of our public container roadmap for fine-grained IAM roles in EKS. To address this need, the community came up with a number of open source solutions, such as kube2iam, kiam, […]
we use EKS IAM roles for Service Accounts, and did not see any issues with them, works fine

Here at AWS we focus first and foremost on customer needs. In the context of access control in Amazon EKS, you asked in issue #23 of our public container roadmap for fine-grained IAM roles in EKS. To address this need, the community came up with a number of open source solutions, such as kube2iam, kiam, […]
2021-03-15
Hi does anyone have a recommended approach on injecting passwords to kops templates using cloud int?
Can you describe the use-case?
2021-03-19
Hello everyone, I am configuring Federated Prometheus to monitor multiple Cluster for the first time. Any tips? On how to organize operators and etc? Tks!
I prefer to use thanos
@Fernanda Martins you may have a look at this video it is well done about monitoring couchbase across multiple kubernetes cluster. You’ll then be able to figure out more
https://connectondemand.couchbase.com/watch/UgdEWF5i4cMRkA9VY8Fwck
Prometheus is rapidly becoming the de facto standard for monitoring metrics and is typically combined with Grafana as the front end visualization tool. The Couchbase Autonomous Operator can deploy the Prometheus Exporter along with a cluster. In this session you’ll learn how to deploy the Prometheus Exporter and deploy Prometheus and Grafana services to visualize Couchbase metrics. We’ll show you how to monitor these metrics from multiple Couchbase clusters.
2021-03-20
anyone using EKS with fargate profiles? I am on a project where we started using it and we had to submit a support request to increase the maximum number of profiles in the cluster from 10 to 20. A fargate profile maps to a kubernetes namespace, so I’m essentially looking into 20 namespaces in these EKS clusters. That’s in my view a fairly small number, and I expect these to increase as we add more apps onto the cluster. Maybe be worth mentioning at this point, that by default I can launch about 1000 fargate nodes on a EKS cluster, so EKS was designed to scale. Anyway the docs list the fargate profiles quota as possible to be raised through the console, but that’s incorrect, so I raised a support request to do this. The feedback I received was that they would raise it with the fargate service team as it was a fairly large increase. My thought here, is he serious ? we’re talking about 20 namespaces/fargate profiles. What exactly is large about this request? A google search didn’t show any relevant posts of the number of fargate profiles, so I thought of coming here to ask: who here is using fargate on EKS, and how many namespaces are you using?
we have a module for it https://github.com/cloudposse/terraform-aws-eks-fargate-profile
Terraform module to provision an EKS Fargate Profile - cloudposse/terraform-aws-eks-fargate-profile
and we tested it, but we don’t use it in production (for many reasons, one of them is that Fargate is still very limited)
having said that, 20 namespaces is not a large number, you usually have more than that in a cluster
Yeah, Fargate selector forcing a namespace is very… annoying. There is a feature request to support * for namespace and use labels for selection: https://github.com/aws/containers-roadmap/issues/621 . That would make the “many tiny namespaces” usecase easier.
Support does not lie If they say they need to talk to the Fargate Team, they mean it. Sometimes it’s an instant approval from the Team. Other times, you’ll get into a discussion with the Team through Support (which is like paying a bad game of telephone, but I digress). I think they do this because: 1) research: they want to see what use-cases people use so they can use that info for future improvements 2) complexity: they don’t want to overload something else (10 namespaces may put a bigger load on the EKS Control Plane and so they will have to scale that too, but only in certain cases). Maybe they have to scale some fancy internal Fargate component that requires some extra work 3) safety: they want to offer some protection. In your case, 20 Fargate namespaces will allow you to run 20k pods which would be… expensive. You’d be amazed how many cases of “AWS pls gimme 10k EC2s” are followed by “AWS WHY DID YOU LET ME DO THIS. I want my money back, I did not know I would create an infinite loop here and spend 100.000$”
the problem Today you have to specify each namespace from which you want to run pods on Fargate in a Fargate profile. the solution EKS with Fargate will support adding wildcard * namespaces to the …
yeah, they do know what they’re doing, by the way, the number of fargate pods is by default limited to 1000 (which is already a LOT) and not per fargate profile. The number of namespaces won’t generate additional load on the control-pane, however a large number of fargate pods will as in EKS/fargate each pod is a k8s node. which needs to be probed by the control-plane
2021-03-23
2021-03-24
Hi. Can anyone recommend articles/videos on configuring k8s on an “airgapped” system? The OS is Centos7. Thanks!
Hi @melynda.hunter. Do you mean as far as accessing a k8s cluster that’s in a an airgapped environment?
kubernetes on a single system? Or an airgapped network with multiple servers
@roth.andy this is for an airgapped network with multiple VM servers.
Got it, yeah there’s not a lot out there. The federal government does kubernetes work in restrictive/classified/isolated environments, so looking for information coming out of there would likely bear fruit. Distros I know they are using is OpenShift and D2IQ. Check out the Air Force program called Platform One, they are trailblazing a lot there, and have published a lot as open source. https://software.af.mil is a good starting point
RKE2 from Rancher is also positioning itself in this space, though it isn’t officially released yet
Teleport can also help with access in an airgapped environment: https://github.com/gravitational/teleport
In full disclosure I work there
There also is a CNCF WG around this. It may or may not be relevant for you: https://github.com/cncf/sig-app-delivery/tree/master/air-gapped-wg
CNCF App Delivery SIG. Contribute to cncf/sig-app-delivery development by creating an account on GitHub.
Thanks to everyone I appreciate all of the information!
2021-03-25
Any body have thoughts on where I should use .Release.Name vs .Chart.Name?
Maybe release name is the name you specify in th cli helm install <name> and chart.name is chart used
2021-03-26
Hi All, we have Elasticsearch cluster running in our Kubernetes cluster and it is deployed using helm chart, and fluentd is sending logs from each nodes,
we have
2 data nodes, 2 master node and a client node, and from yesterday data nodes are in not ready state and because of the client keep getting restarted. so as fluentd and kibana
elastichq-7cf55c6bbc-998pq 1/1 Running 0 1y
elasticsearch-client-5dbccbd776-7kpwk 1/1 Running 79 1d
elasticsearch-data-0 0/1 Running 18 1d
elasticsearch-data-1 0/1 Running 21 1d
elasticsearch-master-0 1/1 Running 0 1d
elasticsearch-master-1 1/1 Running 0 1d
fluentd-fluentd-elasticsearch-hhh8v 1/1 Running 147 1y
fluentd-fluentd-elasticsearch-ksfnx 1/1 Running 110 1y
fluentd-fluentd-elasticsearch-lnbll 1/1 Running 94 1y
kibana-b7768db9d-r57st 1/1 Running 347 1y
logstash-0 1/1 Running 6 1y
after describeing the fluentd pod i come to know that,
Killing container with id <docker://fluentd-fluentd-elasticsearch>:Container failed liveness probe.. Container will be killed and recreated.
after referring to some links i found ———— Data nodes — stores data and executes data-related operations such as search and aggregation Master nodes — in charge of cluster-wide management and configuration actions such as adding and removing nodes Client nodes — forwards cluster requests to the master node and data-related requests to data nodes ——————————————————-
in the kubectl get events output it says rediness probe failed for elasticsearch-data pods(we increased timeout values and recreated all pods again)
so am assuming client is failing because of elasticsearch-data pods are in not ready state, and also in one of the data pod i can see
java.lang.OutOfMemoryError: Java heap space
Dumping heap to data/java_pid1.hprof ...
Unable to create data/java_pid1.hprof: File exists
data pod’s memory limit is 4gb and heap is 1.9 which is fine i think,,,
Since mater node is responsible for adding and removing the nodes i went inside the master pod and did
curl localhost:9200/_cat/nodes
elasticsearch-client-5dbccbd776-7kpwk
* elasticsearch-master-1
elasticsearch-master-0
data pods are not listed here, after checking the logs of master node, i can see lot of
[INFO ][o.e.c.s.ClusterApplierService] [elasticsearch-master-0] removed {{elasticsearch-data-1} master is keep adding and removing the data pods .
and in master-1 logs i can see
org.elasticsearch.transport.NodeDisconnectedException:
we did a helm upgrade <chartname> -f custom_valuefile.yaml --recreate-pods which did not worked.
is there any workaround or solution for this behaviour, Thanks in advance
If you have a Java heap space in the data nodes you should probably raise the -Xmx and -Xms Java opts. In the latest elasticsearch chart provided by Elastic, you can use the esJavaOpts value, see https://github.com/elastic/helm-charts/tree/master/elasticsearch (defaults to -Xmx1g -Xms1g).
You know, for Kubernetes. Contribute to elastic/helm-charts development by creating an account on GitHub.
thank you for that @Antoine Taillefer, we are using stable version of elasticsearch
OK, so maybe data.heapSize, see https://github.com/helm/charts/tree/master/stable/elasticsearch
(OBSOLETE) Curated applications for Kubernetes. Contribute to helm/charts development by creating an account on GitHub.
thank you
Argoproj team is proud to announce the first release candidate for Argo CD v2.0! As denoted by the version number, this is a major release…
i wasn’t aware of this, but the ridiculously low allowed pod count on EKS (i.e 29 pods on m4.large) is tied specifically to the AWS VPC CNI. apparently we can skirt around that issue by uninstalling the default CNI and installing a different one. anyone try doing this? https://docs.projectcalico.org/getting-started/kubernetes/managed-public-cloud/eks
Enable Calico network policy in EKS.
Yes, this is true. It’s since each pod gets an ENI and ENIs are limited by instance type
Enable Calico network policy in EKS.
I hear good things about https://docs.cilium.io/en/v1.9/gettingstarted/k8s-install-eks/
It’s apparently what GKE uses and it works with EKs

GKE’s new dataplane uses the eBPF-based Cilium project to better integrate Kubernetes and the Linux kernel.
gotta give this a shot (and test out other CNIs + EKS). kinda would finally love to outsource our kube master management to AWS
I successfully used Weavenet for a while, until we introduced Windows worker nodes and had to revert (as weavenet does not support Windows)
another thing to consider is whether you care about AWS support (enterprise companies would). If you remove the standard AWS CNI for the XYZ CNI, I would suspect AWS would turn down support requests…
even if you can test “everything” during the first install, you’ll have to maintain your custom solution forever… through all the EKS updates…
having said that, the fact that the AWS CNI uses “physical” IPs sucks (particularly if you have not planned it correctly when deploying the subnets)
fwiw, we don’t keep clusters up forever, we generally blue/green clusters for new kubernetes versions so that gives us flexibility to always update our custom solutions to work w/ EKS updates. although losing AWS support for it would be unfortunate. @Andrea did you use weavenet for the purposes of running more pods on a node?
yes, because I was running out of IPs rather than resources on the EC2 worker nodes..
@Andrea i feel the same way about vanilla EKS and their extremely low max pod count, good to know
2021-03-27
2021-03-28
We’re looking for a nice way to orchestrate performance tests in a k8s cluster, any suggestions?
An example scenario: We want to test the performance of using redis vs using minio as an object cache. Would like to be able to easily setup, run the test, and teardown
Assuming you want to test including cloud provider backing disc etc we would create a pipeline in our CD (Spinnaker) with necessary setup, job, teardown stages.
We would do this in an existing cluster versus spinning one up from scratch as easier and we could still do node isolation. If worried then new cluster which will take fair investment in tooling. Running in kind in CI isn’t going to be very apples to apples with prod..
2021-03-29
Hi, to anyone who’s running Windows worker nodes, can you please share/suggest how to collect the pod logs? On the linux nodes I’ve been fairly happy with fluent-bit (deployed as a helm chart). fluent-bit collect the logs and send them to elasticsearch. I’m not having much luck with the same procedure on Windows though…
